지난 글에서 Spring Boot를 이용해서 Metric 데이터를 수집하였다.
이번 글에서는 Docker를 사용해서 Prometheus와 Grafana를 설치하고 Metric 데이터를 시각화해보자
디렉토리 구조
.
├── docker-compose.yml
├── grafana
│   └── volume
│       ├── grafana.db
│       ├── grafana.db-journal
│       └── plugins
└── prometheus
    ├── config
    │   ├── prometheus.yml
    │   └── query_log_file.log
    │
    └── volume
        └── data
            ├── chunks_head
            ├── lock
            ├── queries.active
            └── wal
                └── 00000000
Docker-compose.yml
version: '3'
services:
  prometheus:
    image: prom/prometheus
    container_name: prometheus
    volumes:
      - ./prometheus/config:/etc/prometheus
      - ./prometheus/volume:/prometheus
    ports:
      - 9090:9090
    command: # web.enalbe-lifecycle은 api 재시작없이 설정파일들을 reload 할 수 있게 해줌
      - '--web.enable-lifecycle'
      - '--config.file=/etc/prometheus/prometheus.yml'
    restart: always
    networks:
      - promnet
  grafana:
    image: grafana/grafana
    container_name: grafana
    ports:
      - 3000:3000
    volumes:
      - ./grafana/volume:/var/lib/grafana
    restart: always
    networks:
      - promnet

networks:
  promnet:
    driver: bridge
prometheus.yml
global:
  scrape_interval: 1s     # scrap target의 기본 interval / default 1m
  evaluation_interval: 1s  # rule 을 얼마나 빈번하게 검증하는지 / default 1m

  # Attach these labels to any time series or alerts when communicating with
  # external systems (federation, remote storage, Alertmanager).
  external_labels:
    monitor: 'codelab-monitor'       # 기본적으로 붙여줄 라벨
  query_log_file: query_log_file.log # prometheus의 쿼리 로그들을 기록, 없으면 기록안함

alerting:
  alertmanagers:
    - static_configs:
        - targets:
          # - alertmanager:9093

# 규칙을 로딩하고 'evaluation_interval' 설정에 따라 정기적으로 평가한다.
rule_files:
  # - "first_rules.yml"
  # - "second_rules.yml"

# 매트릭을 수집할 엔드포인드로 여기선 Prometheus 서버 자신을 가리킨다.
scrape_configs:
  # 이 설정에서 수집한 타임시리즈에 `job=<job_name>`으로 잡의 이름을 설정한다.
  # metrics_path의 기본 경로는 '/metrics'이고 scheme의 기본값은 `http`다
  - job_name: 'spring-monitoring' # job_name 은 모든 scrap 내에서 고유해야함
    metrics_path: '/actuator/prometheus'     # 옵션 - prometheus가 metrics를 얻기위해 참조하는 URI를 변경할 수 있음 | default = /metrics
    #honor_labels: false                     # 옵션 - 라벨 충동이 있을경우 라벨을 변경할지설정(false일 경우 라벨 안바뀜) | default = false
    #honor_timestamps: false                 # 옵션 - honor_labels이 참일 경우, metrics timestamp가 노출됨(true일 경우) | default = false
    #scheme: 'http'                          # 옵션 - request를 보낼 scheme 설정 | default = http
    #params:                                 # 옵션 - request요청 보낼 떄의 param
    #  user-id: ['myemail@email.com']

    # 실제 scrap 하는 타겟에 관한 설정
    static_configs:
      - targets: ['localhost:8080'] ## prometheus
        labels: # 옵션 - scrap 해서 가져올 metrics 들 전부에게 붙여줄 라벨
          service : 'monitor-1'

    # relabel_config - 스크랩되기 전의 label들을 수정
    # metric_relabel_configs - 가져오는 대상들의 레이블들을 동적으로 다시작성하는 설정(drop, replace, labeldrop)
job-name : spring-monitroing 에서 metrics_path의 해당 경로를 접근하여 metric 데이터를 수집한다.
실행
$ docker-compose up -d --buildPrometheus
Status → Target 이동

Spring actuator가 정상적으로 연동된 것을 확인할 수 있다.
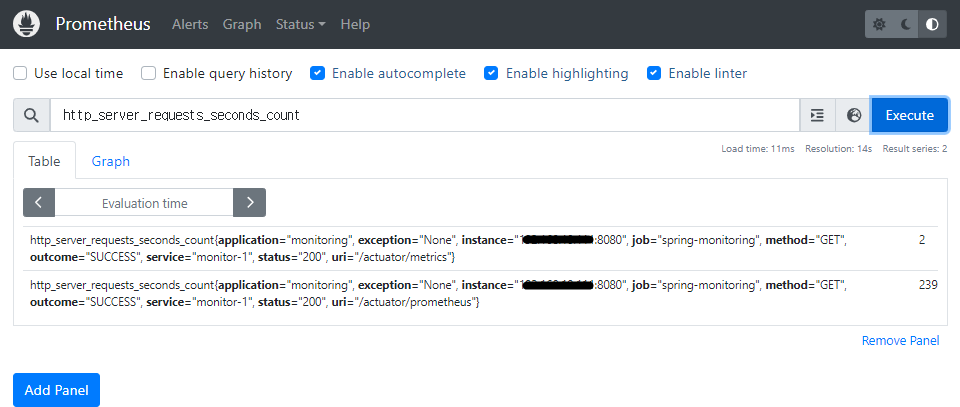
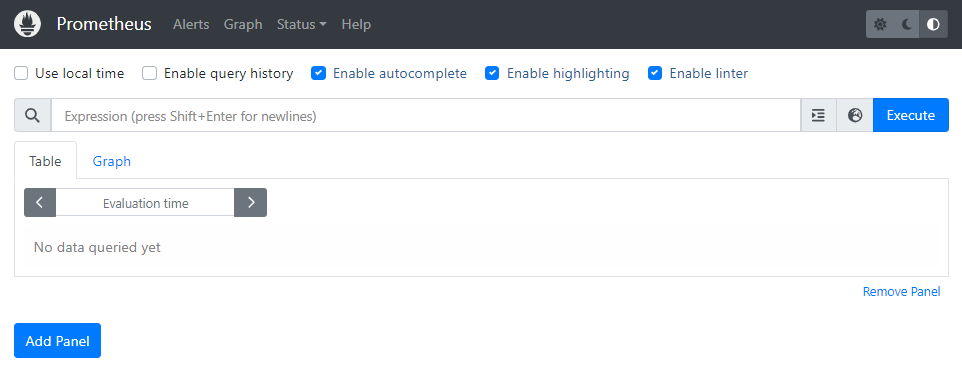
처음 화면으로 돌아가서 http_server_request_seconds_count를 실행한다.
해당 쿼리는 /actuator/prometheus 경로에 http request를 요청한 횟수를 조회한다.

Graph 탭을 눌러 시간별 데이터 추이를 확인할 수 있다.
Promeheus는 Metric 데이터를 수집하는데 특화되어 있고 시각화에는 특화되어 있지 않다. 따라서 시각화에 특화되어 있는 Grafana를 사용하여 시각화를 해보자.
Grafana는 Prometheus에 원격으로 쿼리를 날려 데이터를 가져와 시간별 데이터 변화 추이를 시각화할 수 있다.
Grafana
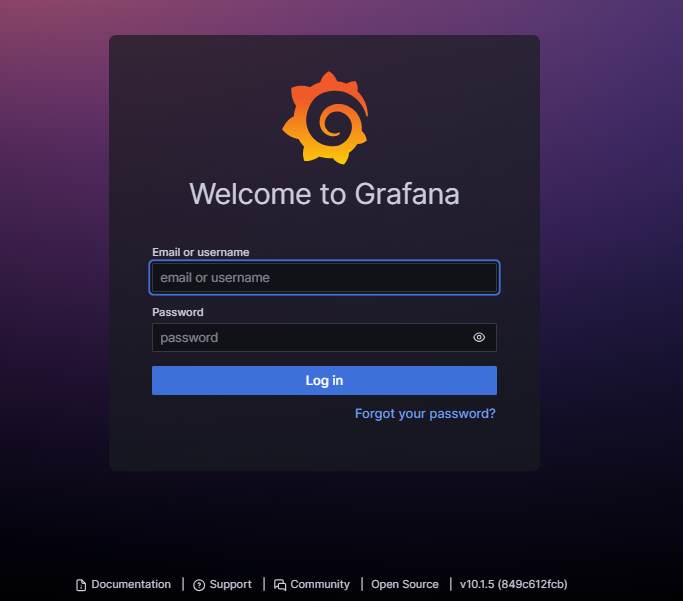
username/password 기본 값은 admin/admin 입니다.

- DATA SOURECES → Prometheus
- Prometheus 연결
- 처음 화면 → DASHBOARDS → Add visualization
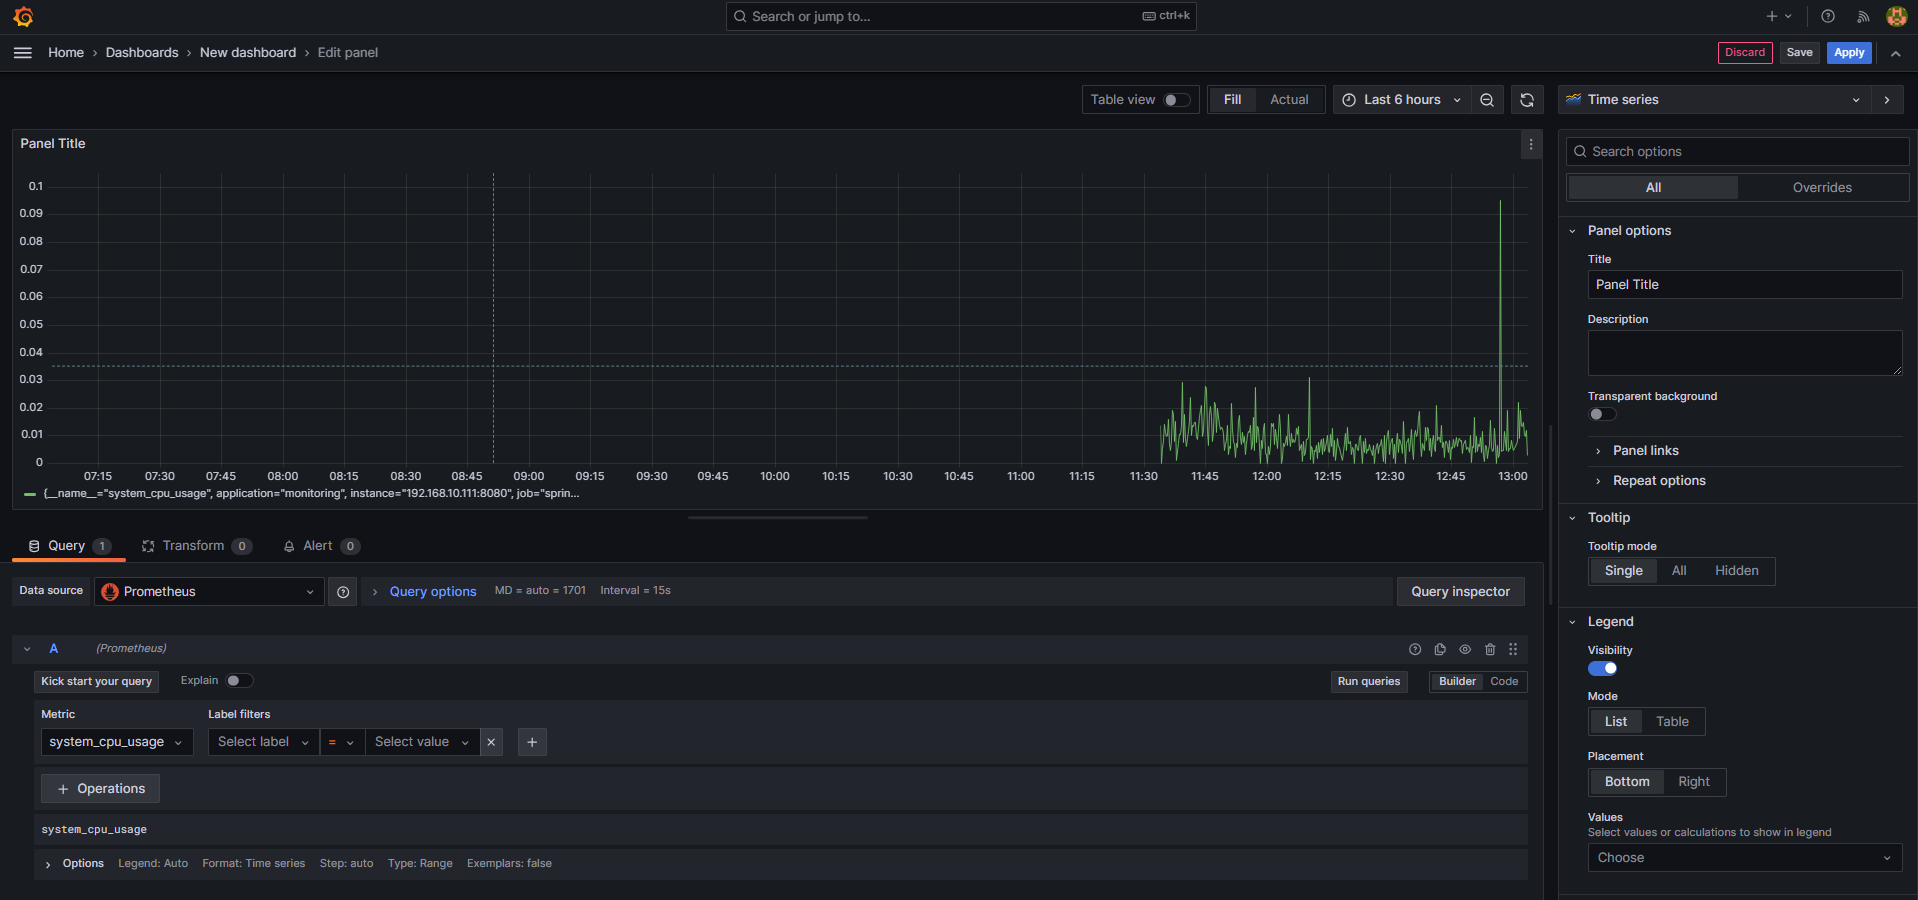
- 왼쪽 하단 Metrics → system_cpu_usage → Run queries
- 모니터링 화면이 표시된다.
- 오른쪽 상단에서 Title 수정 후 Apply

오른쪽 상단의 저장 버튼을 통해 Dash Board를 저장할 수 있다.
참고자료
'Spring' 카테고리의 다른 글
| Spring Mulipart Error (0) | 2023.12.04 |
|---|---|
| Spring Boot Redis + Cache를 사용하여 성능 최적화하기 (0) | 2023.11.16 |
| [Spring] log 파일 생성 시 LOG_PATH_IS_UNDEFINED 생성 문제 (0) | 2023.10.27 |
| Spring Actuator 와 Swagger를 사용할 시 의존성 오류 (0) | 2023.10.26 |
| SpringBoot, Prometheus, Grafana를 사용하여 Monitoring 구축하기 (1) (1) | 2023.10.24 |

